Slideshare

mercoledì 22 aprile 2015

Integrating mobile marketing with customer service

Understanding how your mobile strategy can improve your customer service

Martini generationMost of us find it almost impossible to spend time without a smartphone or tablet close at hand. These days, to quote the famous ad for Martino Rosso, we expect to be connected and online  ‘anytime, anyplace, anywhere.’

Indeed the mobile device has become not only a constant companion but also an essential tool. Witness our shopping habits. According to research organisation IMRG, around half of e-commerce sales in the UK are accounted for by mobile devices. Meanwhile, a 2014 survey by Econsultancy found that 13% of us engage in the art of 'showrooming.' Or to put it another way,  we check out goods in store before buying online, using our mobile devices to compare prices and then make the purchase.

And not only do we shop on the move. These days, just about every transaction is mobile-enabled. We contact customer service, move money between bank accounts, check flight details and book restaurant tables. It's a mobile world.

A sea change in e-commerce

But if the mobile revolution is driving a sea change in e-commerce, online marketers are playing catch-up. Few businesses remain unaware of the importance of mobile and many have developed apps or taken steps to ensure their sites are rendered properly across a broad range of devices.

But that's not quite the same as having a comprehensive mobile strategy. In an increasingly competitive online marketplace, simply enabling e-commerce transactions is not enough. If  you're selling to or communicating with customers via mobile, it's vital to remember that this is no longer a secondary adjunct to better established PC/Laptop channel. For many, mobile is the primary route to online services. Mobile users rightly expect a high quality customer experience, just as they would in store or sitting in front of a big screen.

Enhanced mobile customer service

But becoming a mobile-aware business is not just about replicating existing services or converting via the device. It is also about providing enhanced service and assisted sales support that plays to the strength of the medium.

For instance, when an airline sells a ticket online, that's just the beginning of a relationship that continues as the customer prepares to leave home to catch the flight, arrives at the airport, negotiates security and waits for the gate number to show on screen. Throughout that relationship, the smartphone provides an ideal medium to provide additional information. Similarly, a retailer can provide product information as customers walk around a store.

More fundamentally, mobile devices offer consumers a chance to seek information ahead of making a purchase  or access after-sales care regardless of time and where they are.

Getting the message

Text based messaging provides a cost-effective way to deliver additional layers of service.  For example, live chat is already familiar to (and popular with) online customers who use PCs and laptops. The same chat based engagement can be delivered easily via apps and mobile websites.

Using LivePerson's LiveEngage platform, chat sessions can not only be triggered by on screen buttons, allowing customers to talk directly to agents. Alternatively chat can be actioned by the customer scanning an QR or bar code when in store, again providing easy access to an agent.

Fish where the fish are gathered

As any good angler will tell you, the best place to drop a line in the water is the location where the fish are gathered. And by communicating via mobile chat you are effectively going to find your customers on their devices of choice. Equally important you are meeting their expectations.

A cost-effective channel

Those expectations are increasingly high. Customers want to be able to contact organisations at a time of their choosing, and that is a challenge to in terms of the resources available. However, text based messaging is a cost-effective channel as a single agent can handle multiple engagements simultaneously. This is in sharp contrast to the voice channel on which agents are locked into a conversation with just one person for the length of the engagement.

That's an across-the-board benefit regardless of whether the customer is using a handset or laptop  but  mobile chat/messaging offers a specific cost-saving. Our experience at LivePerson suggests that customer issues are resolved much more quickly on the mobile messaging channel than is the case on PCs and laptops.

In other words, companies with a focus on customer service can engage with their consumers much more efficiently in the mobile space.

Mobile devices are with your customer from the moment the alarm rings to the point at which they fall asleep. There's a good case for saying that your company should also be close at hand via messaging options.

Copyright/Image: 123rf.com


from Smart Insights http://ift.tt/1G5zEOR
via IFTTT

martedì 21 aprile 2015

7 steps towards a more structured approach to Content Marketing

Content Marketing is more than just publishing content...

When Doug Kessler (Velocity Partners) published his Slideshare ‘Crap: the single biggest threat to b2b content marketing’ it rightly got a lot of attention (one million views and counting).

I think that the popularity of this Slideshare was not only because of the great title, but because it highlighted the challenge of getting cut-through as more B2B brands are spending more time on content marketing. Now B2B buyers cannot move for the flood of Ebooks, blog posts, and infographics (which are getting longer by the day!). According to the CMI:

 74% of marketers say they are producing more content than they did a year ago, but 70% of content produced gets wasted each day! 

From my experience of working with brands and training marketers on content marketing, there seems to be a common experience with initial adoption of Content Marketing.  You know you need to be doing something, so you start on say, an e-book. Yet without a plan, defined objectives and a little insight to your buyers issues and pain points, success is limited and ROI will be difficult to define (which doesn’t help content marketing get buy in from the C suite). We know from this Smart Insights-HubSpot research that the majority of businesses don't have a content marketing strategy.

Towards a more structured approach to Content and Inbound marketing

To help provide a structure to follow based on my experience in B2B Inbound marketing projects, I've created a new Smart Insights template (available for expert members) that follows the 7 Step process Planning process outlined below, using a pre-built fill-in-the-gaps style document to use immediately.

Here is an outline of the 7 Steps we have defined in the template.

Step 1: Objective and Goals

Before you brainstorm your blog posts and next hero eBook topic, start by identifying the target numbers.  How many leads do you need? What are your business objectives? What are your Key Performance Indicators?

If you are justifying this marketing strategy for your company, you need to show how it fits in with their overall goals and objectives, and that you will be working with KPIs to review and assess performance.

This stage is also important as you need to know what your sales conversion rates are. For example, if content marketing is to generate 20 sales and you convert 10% of all leads, your content marketing actually needs to deliver 200 leads on your website.

Step 2: Buyer Journey and Pain Points

You would have heard people say, write content that identifies with your prospects pain points.  To get to this golden insight you need to have a good understanding of your customer summarised in Buyer Personas.

Consider the following:

  • What does their buyer journey look like?
  • What channels and forms of content do they touch from Awareness, Consideration and Decision?
  • What questions will they ask at each stage?
  • What keeps them up at night?

Focus on umbrella themes for your buyers and drill down into individual issues and problems that your product or service solves.

Step 3: Content Mapping: audit to the sales funnel

Before you jump into creating more content, have a look at what you already have. Do an audit, but map this to the sales funnel. This is going to show you gaps and priorities on what to start creating first, and will identify existing content that could be recycled or repurposed.

The-AIDA-model

You should filter this using your personas and target audience insights to ensure you have content that matches their pain points. Also filter by sectors if that is relevant for your business.

Step 4: Budget

Before you jump into creating and hiring people to make your amazing content, how much budget do you have to play with? How much resource do you have with your team and staff?

Be realistic with what your budget can achieve, focus on creating content that fills your audit gaps, and recycle and repurpose what you can.

Tip: Don’t just allocate budget for the production, you are likely going to need budget to cover distribution of your content.

Step 5 : Ideas for content

With your budget in place and an idea of how much time you and your team can spend creating/managing the content marketing process, you can start to think about what content you are going to be creating.

Staring at a blank piece of paper can be daunting, so start by focusing on the missing items from your audit. Estimate how frequently you can create content from your budget. Plan the formats you will create content for, i.e. video, blog, ebook, and when you will do it, e.g. 1 per quarter, 1 per week.

Once you have this list, focus on the quick wins – what content can you repurpose and reuse? Do you have a number of blogs that could be made into a book? Do you have a PowerPoint from an industry event that could be turned into a blog pots?


RelevanceSuccessful content needs to be relevant and helpful to your buyer, and answer the questions they are asking.
It also needs to hit them along the buyer journey in a “one of a kind way”, i.e. it shouldn’t appear anywhere else on the web, in what Rand Fishkin called Uniquely Valuable.

 To be ‘Uniquely Valuable’ your content needs to be:
  • A massive upgrade in aggregation, accessibility, and design,
  • Information that is not available anywhere else,
  • Presented in a clearly different voice or style

To help come up with your ideas, I use this formula. Source + Theme + Format + Idea = Engaging Content

  • Source = curated, created, co-market, or recycled
  • Theme = your buyers pain points and issues
  • Format= video, checklist, case study, ebook, reports, podcasts
  • Idea= debates, how tos, news article, top 10s , interviews

Step 6: Promotional Plan

As should now be obvious, content marketing needs a lot of time and resources. Aside from the time and effort you need to invest up front, your content will need continued investment once it’s ready. You need to sell it!

Having a good understanding of your marketing performance across your earned, owned and paid media is crucial for this planning phase. Work out how many visits your blog has; what is the average CTR to a landing page? How many people do you have on social, and what is the average traffic to your landing page? If you have gated content, what is the conversion rate for your landing pages?

Tip: Have a detailed promotional plan in place to support your marketing efforts and highlight what you realistically need to do in order to hit your desired outcomes.

Step 7: Implementation

So, you’ve made it to the end of the process and you’ve done all of the following:

  • Set out and validated realistic objectives of how to reach your business goals
  • Understood your audience’s pain points
  • Planned how you will structure your message along the journey
  • Audited your content stock to highlight your gaps and quick wins to focus on
  • Charged up your team with possible ideas
  • Put a budget and promotional plan in place

Now, you have to do it!

This is where your operational and editorial plans are key to identifying who is going to do what, by when, giving time to approve, produce and promote your content.


from Smart Insights http://ift.tt/1K1iYw1
via IFTTT

Display advertising clickthrough rates

US, Europe and Worldwide display ad clickthrough rates statistics summary

I've put this compilation together to help marketers and students studying interactive marketing create direct response conversion models for digital marketing campaigns.

When I originally compiled these stats from different sources, social media ads were only in their infancy, but they are now established as a mainstay of online advertising. In this latest update I have added a comparison of CTRs for Facebook and Twitter at the end of post.

If you're looking to get more from your display advertising we have an Expert members guide to retargeting with display ads

Display Ad CTR benchmarks - April 2015 update

The best source for current benchmarks is Doubleclick (the display advertising arm of Google) who have this regularly updated interactive Display Benchmarking tool as part of Think Insights. You can select by country, sector and ad format to create your own benchmarks. Here's our summary of current global Ad CTRs:

1. Overall Display Ad CTRs

Across all ad formats and placements Ad CTR is 0.06%

So, this is less than 1 click per 1000 impressions.  

2015 Ad Clickthrough rates - global

2. Rich media CTRs

Rich media Ad CTR is 0.27%

Across standard and rich media, this shows an ad clickthrough rate of 0.14% which is more realistic estimate if ads will be placed on the fold. For Smart Insights advertisers we offer an MPU in the right sidebar above-the-fold and this has a typical CTR of 0.15 to 0.22% depending on the creative and content asset on offer.

Comparison of rich media and standard media CTRs


3. Ad CTR trends 

This chart, also from the Doubleclick shows that the 0.1% CTR has been an average for some time.

Ad CTR Trends

For anyone researching trends in display advertising in different countries or sectors you could try the Doubleclick Ad Research page - these reports don't tend to be updated so frequently though.

Facebook ad clickthrough example

These Facebook Ad CTRs for different types of ad formats are taken from a test run by Smart Insights contributor Marie Page. They show that by using targeting in Facebook it's possible to improve on general Internet ad clickthough rates.

Boosted vs Promoted post vs ad results

Variation in online ad clickthrough rates by country

This is historic data for reference - for the latest use the interactive Display benchmarking tool.

Region Overall Click-through Rate Percent (%)
North America
Canada 0.09%
United States 0.10%
EMEA
Austria 0.11%
Belgium 0.13%
Denmark 0.12%
Finland 0.05%
France 0.12%
Germany 0.11%
Greece 0.17%
Ireland 0.10%
Italy 0.10%
Luxembourg 0.09%
Netherlands 0.14%
Norway 0.11%
Spain 0.12%
Sweden 0.08%
Switzerland 0.12%
United Arab Emirates 0.18%
United Kingdom 0.07%
JAPAC
Australia 0.07%
China 0.12%
Hong Kong 0.17%
India 0.18%
Malaysia 0.30%
Singapore

0.19%

Source: DoubleClick for Advertisers, a cross section of regions, January and December 2009, Published July 2010

For latest data see Doubleclick Display Ad Benchmark Statistics.

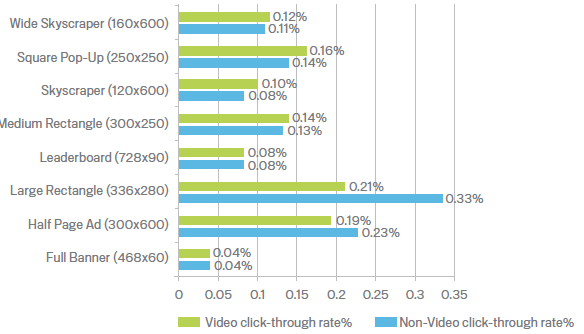
Variation in online ad Clickthrough Rates by ad format

Ad clickthrough rate naturally varies according to placement (position on screen) and ad format (shape and size). The traditional full-banner performs very poorly compared to skyscrapers, the ubiquitous medium rectange and the newer large rectangle format.

Variation in online ad Interaction Rates by ad format

Interaction rats differ for different ad formats in a similar way to ad formats.

Interaction rate definition:

Interactions are defined as the user does one or more of the following:

  • Mouses over the ad for 1 continuous second
  • Clicks an Exit link
  • Makes the ad display in Full Screen mode
  • Expands the ad

Social media ad clickthrough rates - a comparison of Facebook and Twitter CTRs

Wordstream have posted an interesting analysis comparing Facebook and Twitter. It's generally known that Facebook has low CTRs because ad units are not that prominent - it's similar with LinkedIn. Although this is changing as more prominent ad units are created, particularly on mobile.

twitter-vs-facebook-ctr

You can read the full analysis from Larry Kim on Facebook vs Twitter CTRs on Wordstream which includes a wider analysis of the importance of their advertising including mobile.


from Smart Insights http://ift.tt/MWrPUq
via IFTTT

Which are the most effective types of marketing email? [#DigitalInsights]

New DMA research shows the trends in email effectiveness - which these types of emails work for you?

We are excited to share the findings from the DMA's 'National Client Email Report 2015' which has just been published. It reinforces the effectiveness of email as one of the core digital marketing techniques and shows that email marketing is still growing in popularity and its success is derived from an integrated marketing approach, accessibility to Marketing Automation and being impacted by the rise in mobile with an email-mobile relationship, which they refer to as a 'mobile first-medium'.

Companies are seeing return from continuing to use email marketing - according to the report Email has an average return of 38:1!'

Which emails generate the most revenue?

We know intuitively that effective emails are personalised, so it's good to see an improvement in targeting practice with revenue from unsegmented emails to the whole list dropping to 14% of revnue. Amongst respondents, segmented-targeted emails now account for over 58% of revenue.

DMA research email types

You can see that there is also a substantial growth in triggered email campaigns, as a result of Marketing Automation Systems/Tools. The driver here is from higher CRO through 'timing and contextual relevance' rather than volume. The research also shows the revenue generation arises from Marketers offering relevant messages/offers throughout the customer life cycle.

Which are the most popular type of emails?

The research went into more depth on the types of emails - respondents were asked to rate the most popular. It's the most comprehensive list of the different types of emails available.

Most popular types of emails


You can see that marketers use a wide variety of approaches to reach their clients but newsletters, welcome messages, and customer surveys are the top three ways for them to achieve their campaign objectives. Welcome messages, the second most popular email type, are easily created through any professional ESP or email marketing software and are often used for engagement or direct sales objectives.

Once marketers use welcome emails, they are more likely to use other time and behaviour triggered messages like purchase confirmations or birthday emails.

Registered members on Smart Insights can find out the latest trends in email creative, content and targeting in our guide published at the start of the year


from Smart Insights http://ift.tt/1O9JLMt
via IFTTT

lunedì 20 aprile 2015

How to psychologically interpret website analytics

Massive amounts of analytics data can confuse and point you in the wrong direction. Here’s how to understand what your website visitors are really doing

Print-outs of analytics reportsWeb analytics can be extremely useful, but it the data can also be a curse. Indeed, online we now live in a world swimming with data, so much so we have to call it “big data”. The problem with big data is it needs big analysis. The more analytics you collect, the more time it takes to wade through the reports and try to work out what is happening with your website.

Google Analytics, for instance, has 103 standard reports you can look at. That’s before you start adding your own specific requirements and comparisons. In addition, there is a problem with all of these reports; none of them tell you “why” a visitor did what they did. All that analytics data can show you is an historical picture of what happened. This is a real problem in marketing because the crucial piece of information you need to know is “why” someone does whatever it is they do on your website. Only by knowing “why”, instead of “what”, can you improve your website to match user intentions, emotions and desires. (See Analytics only provides a partial answer for marketers for more information.)

So, this article will help you use your analytics data to find out the psychological factors involved with your website, to help you get closer to your visitors’ true requirements. You will discover:

  • How to zoom in on key psychological issues revealed in analytics
  • What data to concentrate on for real behavioural factors
  • Ways in which you can use the data to improve visitor experience

Analytics don’t always tell you what you think they tell you

Recently I sat in a meeting with the directors of a large manufacturing firm. They proudly spread out pages of analytics date which confirmed that they were well-known and that people “loved” the website. I inquired as to which parts of the data demonstrated that. They pointed to the keyword data for organic search which showed that almost 90% of all searches were for the company name. Then they showed me the data for the time spent on the site, showing that people were spending four or five minutes at a time.

This is a familiar scenario, the “headline” data can mislead.

In drilling down into the detail, you could see, for instance, that even though people were spending around four minutes on the site, they were doing so by visiting dozens of different pages, all for a few seconds at a time. The “user flow” data showed that people were often going back to pages they had already visited. Meanwhile the “content drilldown” report showed that people were going through several different pages, with very low amounts of time actually spent on the final page prior to exit.

The directors were focused too much on the headline data, whereas the detailed data showed a picture of confused visitors, not knowing where to go, or not finding what they wanted. The fact that almost all of them had arrived on the site as a result of searching for the company name suggests they knew the company and its products and wanted more information about something, but were struggling to find it.

Analyse using narratives

Data analysis can be confusing. In busy offices it is often easy to focus solely on headline data, but this can lead you to false assumptions about a website.

Drilling down into the data helps, of course, but you have to balance that with the time it takes.

An easy way to sort through the data is to create a narrative. Instead of focusing on the detailed data itself, consider instead a human being and write yourself a story about their behaviour, based upon the data you see. Your narrative might be about a person and what they are looking for. Start with the keyword data to see what someone typed in. Then, when you have chosen a phrase you know that someone was sat in front of their computer and typed in those words. Take a look at the page they arrived at having typed that phrase into the search engine and use the data on the keyword to see how long they sat looking at their screen and how many pages they clicked on. In other words, instead of focusing on data and graphs, turn what you see into a story about a user and what they were doing and looking at when they sat facing your website. This makes data analysis easier to interpret because you can visualise what is going on with your website. Once you have the narrative and visual in mind you can more easily decide what to do with your website to improve the situation.

Focus on the right data

There are plenty of different analytics reports to consider, but in terms of human activity on your website the important ones are the length of time people spend on each individual page and the route they took to get there in the first place.

Online engagement is very low indeed – most reports from Google Analytics shown in the “engagement” report suggest people have spent 10 seconds or less on each page.

That means they are really only engaging with relatively few pages on each website. Attention spans online are low – we expect “instant answers” and we move on quickly if we do not find them. The bulk of analytics engagement data suggests that most pages we visit we do not pay much attention to.

When you look at the time people spend on each page you can see which pages people are engaging with. But you then need to check those individual pages – people may be taking a long time on them because they are the subject they want, but the page is poorly written and so takes longer to read. Once again, seemingly positive analytics data could be negative, unless you take it in context. The combination of time spent on each page, together with an analysis of those pages and what factors contribute to the increased length of time spent is a good means of understanding what your visitors are doing on your website – and why.

Another analytics report to concentrate on to understand behaviour is the originating source of the visit. Has the visitor typed in a keyword to a search engine, have they clicked on an advertisement or have they come from social media? Each of these kinds of visits suggests different motives and so you then need to look at the pages which these visits led to so that you can see if the page landed on actually connects with those motives. For instance, people coming from a social site are doing so on the basis of a recommendation from a friend. That means they are already more positively framed for the visit, so you have the opportunity for this kind of visitor to be more amenable to calls to action. But a visitor coming to the same page from a keyword search is more likely to be looking for information – you will be able to see this based on their pathway after the landing page. You will be able to detect subtle differences in behaviour for different kinds of visitors coming from alternative sources. You can use those difference to create better-focused landing pages for those individuals.

Are you analysing data for data’s sake?

The vast array of reports in analytics software is fascinating and potentially time-consuming. Much of it can help you prepare better web pages, create better pathways and lead to more clicks where you want them. However, all that work with 100 reports or more can be more effort than necessary. Hours of analysis might only lead to one or two additional sales, for instance.

However, your visitors are generally after one thing when they land on your website. It might be information, it might be to make a purchase, or it might be to carry out a specific action.

Generally, though, you can find out what those things are by looking at a handful of analytics reports, analysing the pages that are involved and turning what you discover into a narrative.

Once you have this clear picture in mind, you can then work out what you need to do in order to improve the situation. This could be, for instance, by rewriting the copy. Or it could be by creating different pathways for different motivations. Or it could be using alternative landing pages more frequently. Ultimately, from a psychological perspective, your website needs to engage people emotionally if visitors are to take the actions you want them to take and buy from you. Analytics does not tell you the emotional triggers of visitors. But by carefully selecting the data you analyse you can get closer to understanding what makes your visitors tick. Just concentrate on how long they are spending on each page and how they got to that page. That will tell you the beginning of why they are doing what they are doing.

See also: Web Analytics Strategy


from Smart Insights http://ift.tt/1cPjJgD
via IFTTT

Applying the Psychology of Persuasion to optimise your digital marketing [Infographic]

A summary of 7 principles of persuasion

There is increasing interest in applying the principles of Psychology to Digital Marketing. According to Kath Pay of Cloud.IQ, the benefits of incorporating consumer psychology into your marketing are two- fold:

"First, applying the principles of the Psychology of Persuasion can assist your customer in their journey to achieve their objective i.e. buying a product or service from you, and secondly, you, as the marketer, benefits from facilitating more successful conversions".

Kath has a new free download 'Leveraging Psychology in Digital Marketing' explaining how the relationship between buyer psychology and behaviour can help marketers optimise the online customer journey. It covers the principles and examples from landing pages and email marketing on how you can improve conversion efficiency as part of inbound marketing.

This infographic is a taster of the book's themes to help you get under the skin of your customers through psychological techniques including those focussed on emotion, persuasion and loss aversion. Find out how to encourage your customers to download a brochure through 'persuasion architecture' or encourage rational thinking through emotive copy.

Leveraging Psychology in Digital Marketing infographic

To apply this in practice through structured AB testing you can use this Smart Insights Expert members CRO briefing.


from Smart Insights http://ift.tt/1E0sLBG
via IFTTT

giovedì 2 aprile 2015

How long should you run a website split test for?

When is the best time to call time on a split test??


One of the biggest issues when running a split test is knowing how long to run it for. Confusingly, depending on the split testing tool you use it may tell you when to stop or it may even stop the test for you based on it’s own statistical calculations. For the uninitiated that might sound like job done but in fact it’s misleading and possibly injurious to the final objective. You need to consider a few other things:


Business cycle


For the purpose of split testing, the business cycle, i.e. aggregate trade activity over a given period of time, is often thought of in terms of weeks or months. Years is rather too long to call a result even if it is likely to be statistically more robust. Days are pretty pointless, they are far too short a time frame especially when you consider that conversion rates and traffic volumes will often fluctuate on a daily basis over the course of a week; also it is still the case that for a large portion of the population that two out of seven days in the week are still non working days.


Because of that when running a split testing program the tester needs to make sure that each test is run over a complete business cycle or combination of business cycles.


Purists will argue that the run time of the test should also not favour any one part of the business cycle, so that if your cycle is a week and the test is started at 9am on a Monday morning then it should also end at 08:59 (or 9am) on a Monday morning. Doing this you will be less likely to skew the results by including one part of a business cycle (which may favour one of the variants) but not another.


Purchasing cycle (or decision-making process)


This is perhaps a footnote to the point above. On most e-commerce sites the decision-making process involved in buying a product or service may take longer than a day.


To get a better picture of how this looks go into your web analytics package and look for a report that shows you time lag and / or path length.


In Google Analytics you can find this in the Multi-Channel Funnels reporting area. These reports will show you the number of interactions (Path Length) or the number of days (Time Lag) it takes for customers to buy something. Based on this you will then have an idea of your purchasing cycle.


If you have an especially long purchasing cycle then your test time frame will need to take this into account.


Volume of data


The short answer here is ‘the more the better’. That said it’s impractical to wait for months and months to call a result and really for many e-commerce sites the purchasing cycle is not likely to be that long.


So in most cases it is considered that 300 good outcomes / sales per variant is a minimum.


BUT, if you have your testing tool hooked up to your web analytics tool specifically so you can segment your test results then 300 good outcomes might not be enough. The obvious reason here is that by segmenting a dataset with 300 good outcomes you will inevitably wind up with a smaller less robust dataset with fewer good outcomes and therefore not as reliable. So in these instances you will need to extend the minimum sample size to accommodate your segmentation.


Regression towards the mean


This is the phenomenon where a variable that was extreme on its first measurement tends to be closer to the average on its second measurement or where a variable that is extreme on its second measurement tends to have been closer to the average on its first. In split testing this often reveals itself in circumstances where both variants converge.


This process doesn’t happen overnight. So often at the start of a test the data can look fantastic with the new variant set to bring home the bacon in style, but of course:


  • 1. The sample will most likely be far too small unless you have a high traffic site or you are adopting very broad targeting for the experiment.


  • 2. Partly as a result of (a), as the sample grows the phenomenon of regression to the mean will reveal itself.


So by ensuring that you collect a robust sample of data AND you run for a minimum of two business cycles (preferably more) you should ensure that you will have accommodated for this phenomenon.


It’s important to remember that the criteria above are not a pick and mix set of options. It’s not the case that if you are able to collect 300 good outcomes per variant before the you have completed one business cycle (due to high traffic volumes) then you have a reliable result, even if your testing tool calls it. You should wait until you have a minimum sample size PLUS at least one full cycle (preferably two), this underscores the point that generally speaking the more data you have the more robust your results will be.


There is another, possibly rather more obscure reason, why tests need to run for longer although and this is harder to measure but is potentially linked to the final point about regression to the mean.


When running a split test you are, by definition, introducing your customers and returning visitors to a new page layout and possibly even a new process on your site. Some people will take to the newness quicker than others, but once it has been in the wild for long enough and your sample has become used to it, they may only then start to find it easier to use and only then might it start to yield a positive return when compared to the control. This is basically the inflexion point of the test.


Key takeways on planning your time to test


Of course it may be that the inflexion point is never reached but all this is to say that:


  • 1. There are some clear guidelines and principles as to how long you should run a test for.


  • 2. If you see your test variant performing atrociously to begin with do not think that it stands no chance of ever recovering and pull the test in order to avoid losing revenue.


  • 3. Remember that things take time to bed in.


from Smart Insights http://ift.tt/1FkjrHP

via IFTTT