Slideshare

giovedì 28 novembre 2013

Guide to YouTube Analytics Part 2

youtube_analytics In Part 1, we looked at the main features of YouTube Analytics (YTA) and how they can be used to a) build an audience and b) improve the engagement of your existing audience. In this article, we are going to look in more detail at 5 of the key reporting features available in YTA.


To get ideas and inspiration on creating the right type of videos and YouTube brand channel to maximise video plays and sales, see our new guide to YouTube Marketing.


1 Youtube Traffic Source data


The Traffic Source feature offers in depth information about how and where your viewers are coming across your videos. Having an understanding about the sources which are bringing you the most/least traffic is useful in determining how you will focus your future resources.


YouTube analytics traffic source 1


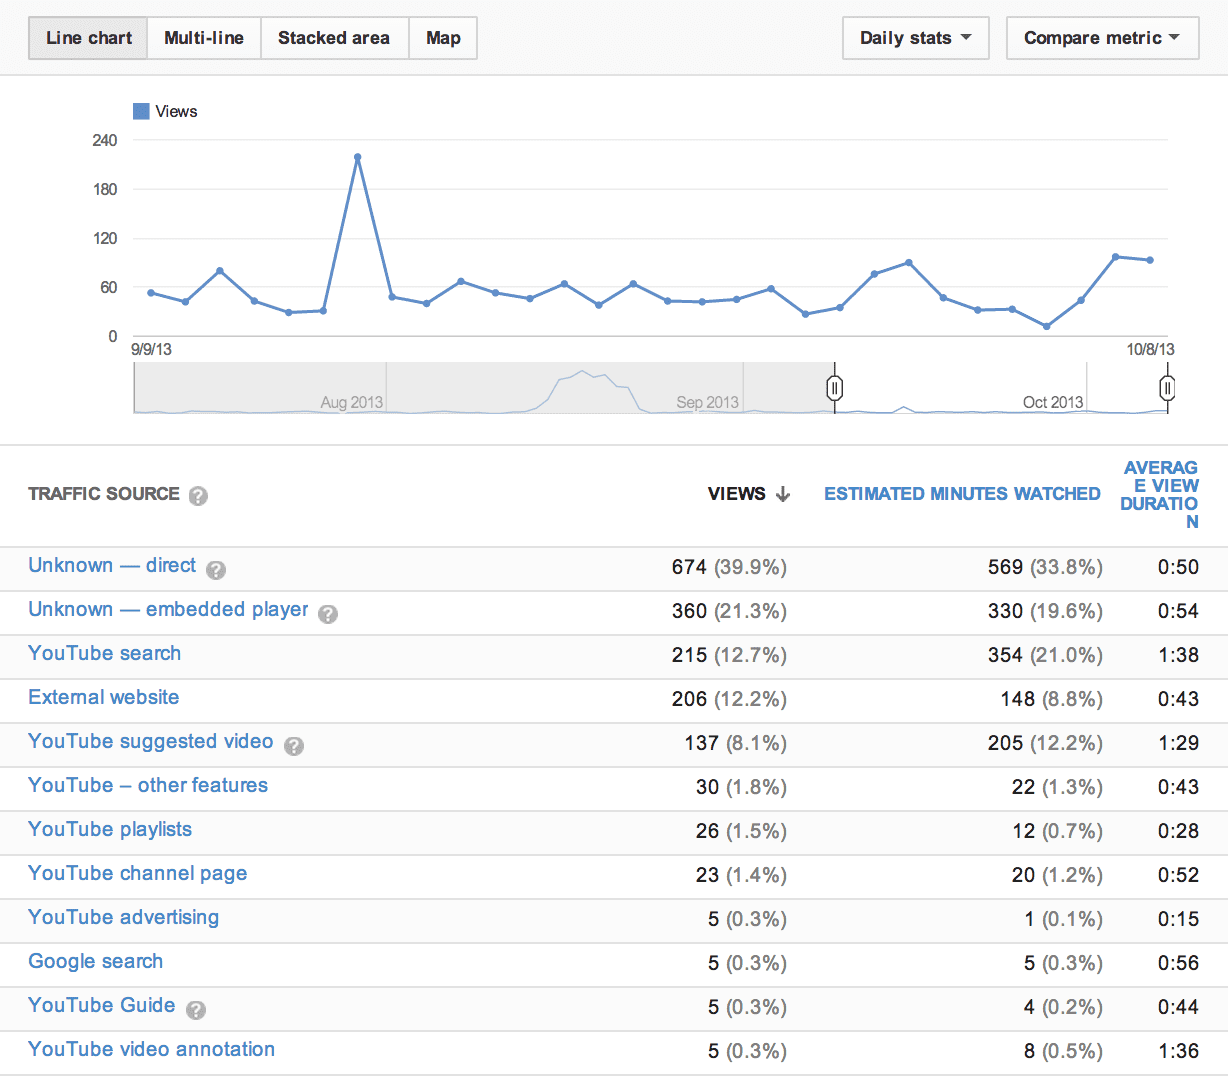
In the above image you can see the result of clicking on the ‘Traffic Source’ tab. It provides a general overview of the main sources of traffic, including the various possible routes within YouTube itself e.g. YouTube playlists or adverts. In the image below, you can see the result of clicking the ‘External website’ option:


YouTube analytics traffic source 2


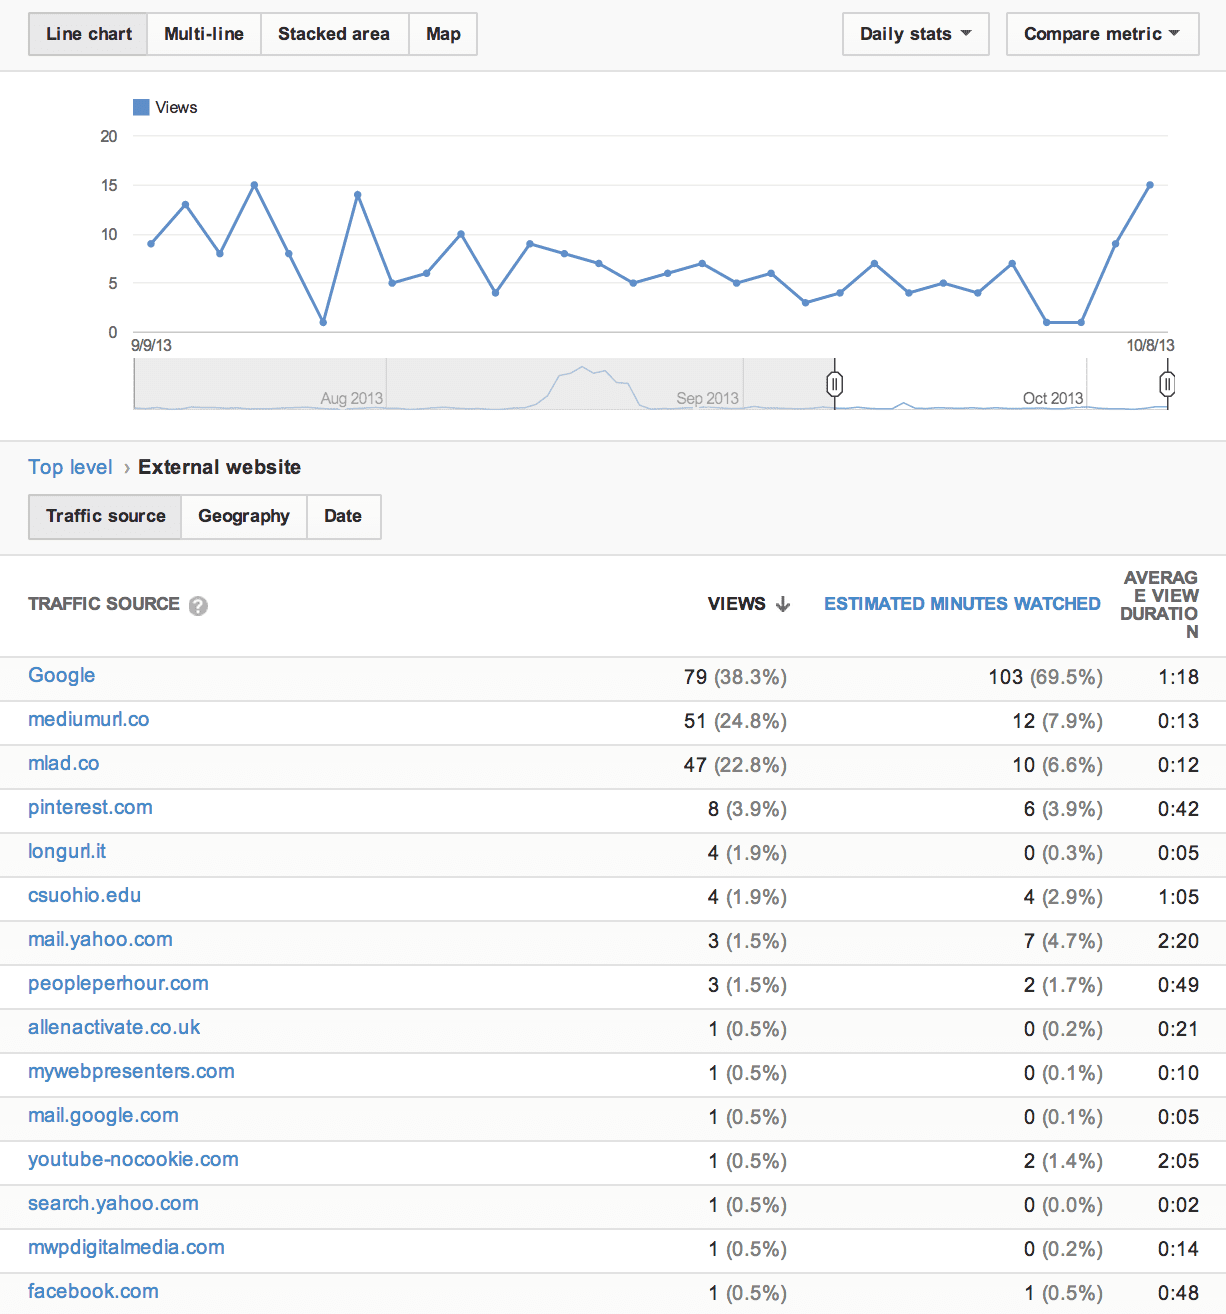
This option gives you a breakdown of all of the external websites that are bringing viewers to your videos. You can see in this example that Facebook isn’t bringing as many views as one might expect. This might therefore be a traffic source worthy of more attention – maybe a dedicated strategy. On the other hand, it may be that Facebook isn’t the appropriate forum for this particular audience.


If a very specific website seems to be sourcing some traffic but not a lot, you can consider contacting them to arrange mutually beneficial partnerships (e.g. sharing each others videos or working together on video collaborations).


YouTube analytics traffic source 3


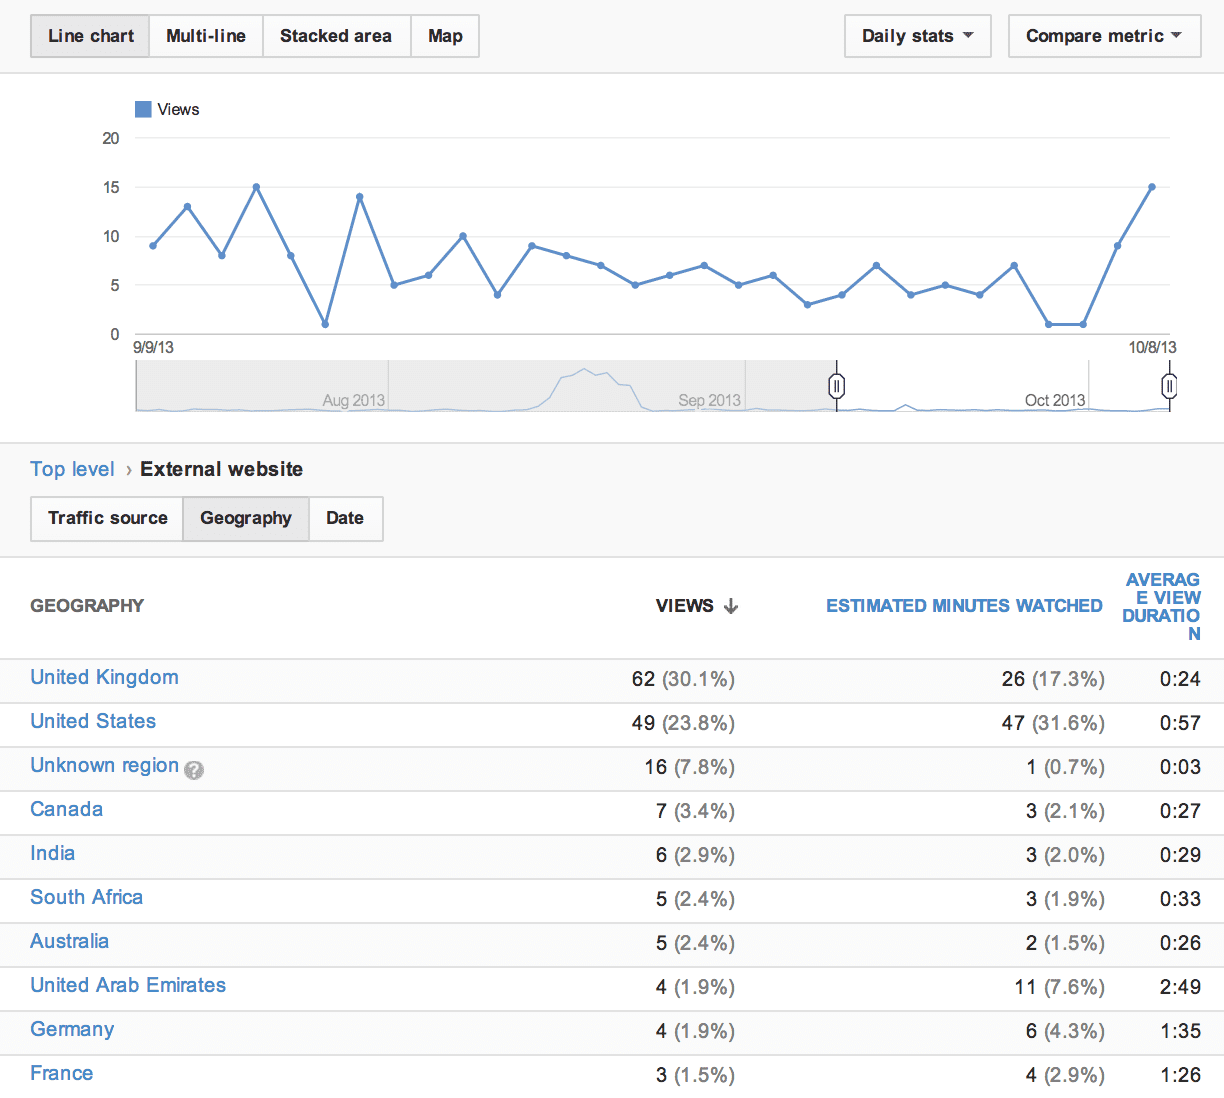
YTA provides layers of analysis. The above diagram is the result of clicking on the ‘Geography’ tab in order to see the sources of traffic from external websites by their geographical location. How you assess this information will depend on your own location, and your goals. Again, this information can help you decide how to allocate future resources.


2 YouTube Subscriber Data


The Subscribers reporting features allow you to understand what makes your viewers subscribe or unsubscribe.


YouTube analytics subscribers 1


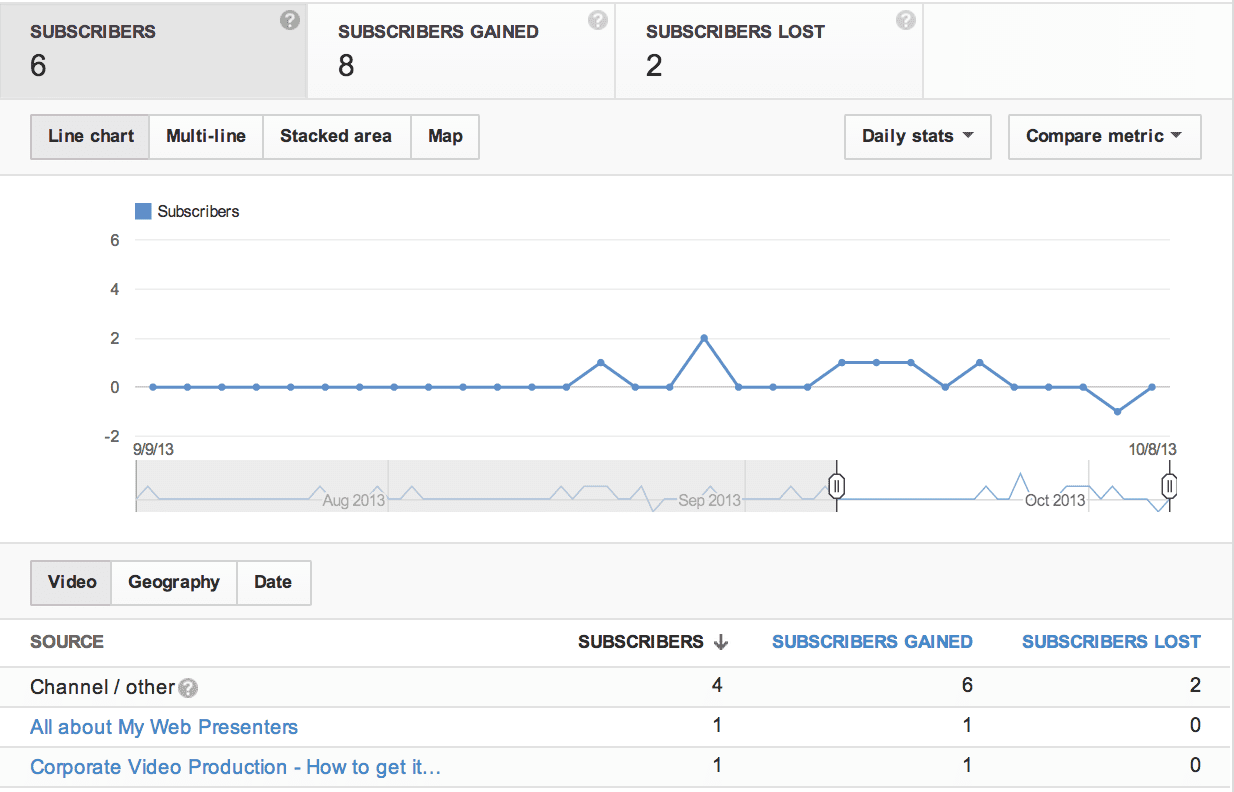
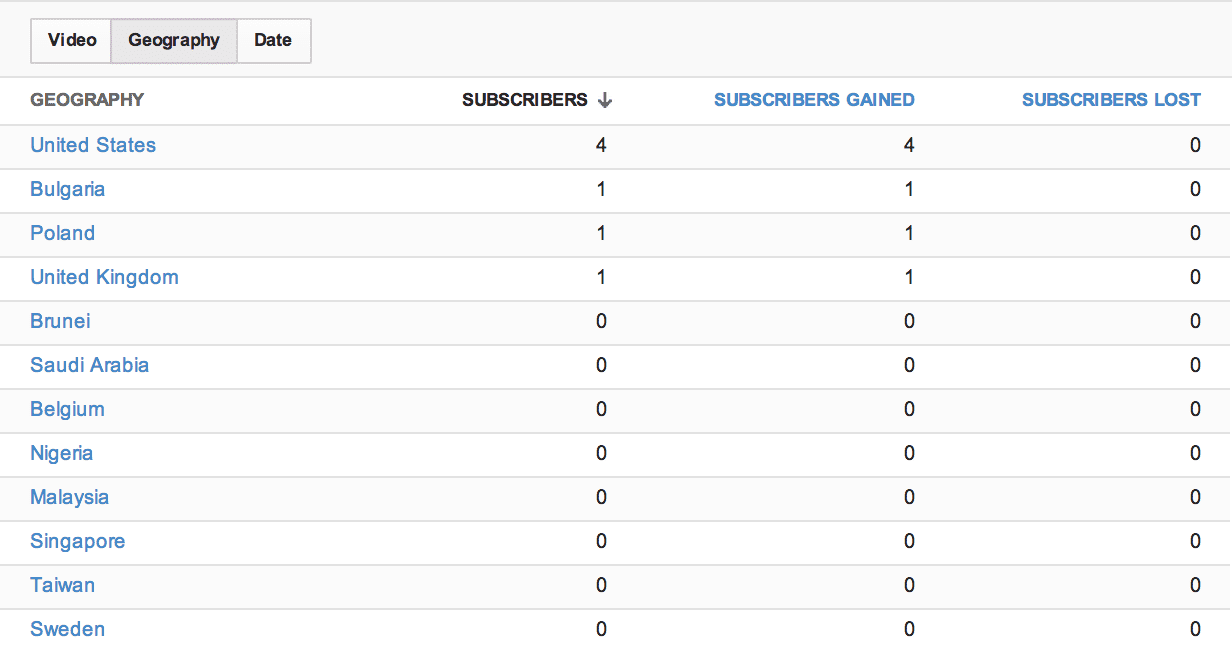
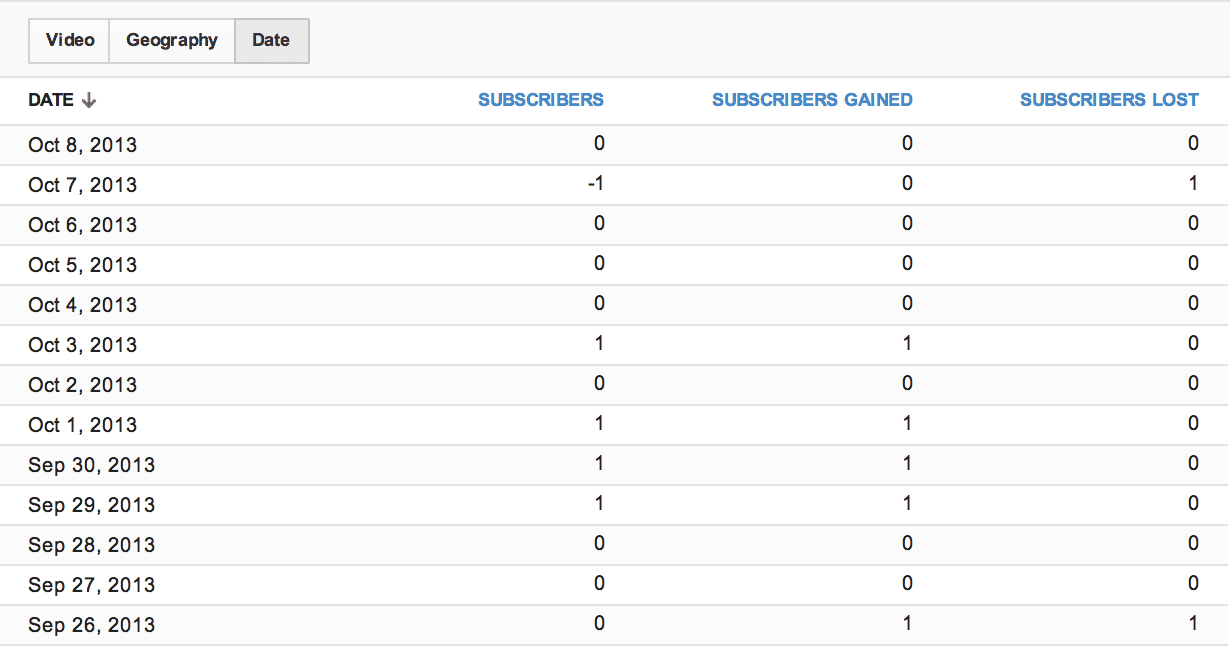
You can analyse an increase or decrease in subscribers by video, geography or date.


YouTube analytics subscribers 2


When looking by video or date, you can work out which of your videos are having the biggest impact on your audience. If particular videos are failing to bring in new subscribers, you can consider adding annotations or adding links in the description to encourage viewers to subscribe.


YouTube analytics subscribers 3


Ultimately, your most subscribed content should be that which you build upon. A subscription is a strong endorsement of your content and reveals the type of content you should be making more of.


3 YouTube Audience Retention


Having knowledge about how viewers are interacting with your videos and how long they are watching them for can help you become better at making content that engages audiences for the duration of a video.


The Audience Retention feature in YTA includes an ‘Absolute Retention’ graph. This graph is useful because dips tell you which sections of your video audience like and dislike. Dips in the graph represent when viewers are fast-forwarding or switching off from a video at that point. Peaks represent moments when that the audience is rewatching. See the example below:


YouTube analytics Audience Retention 1


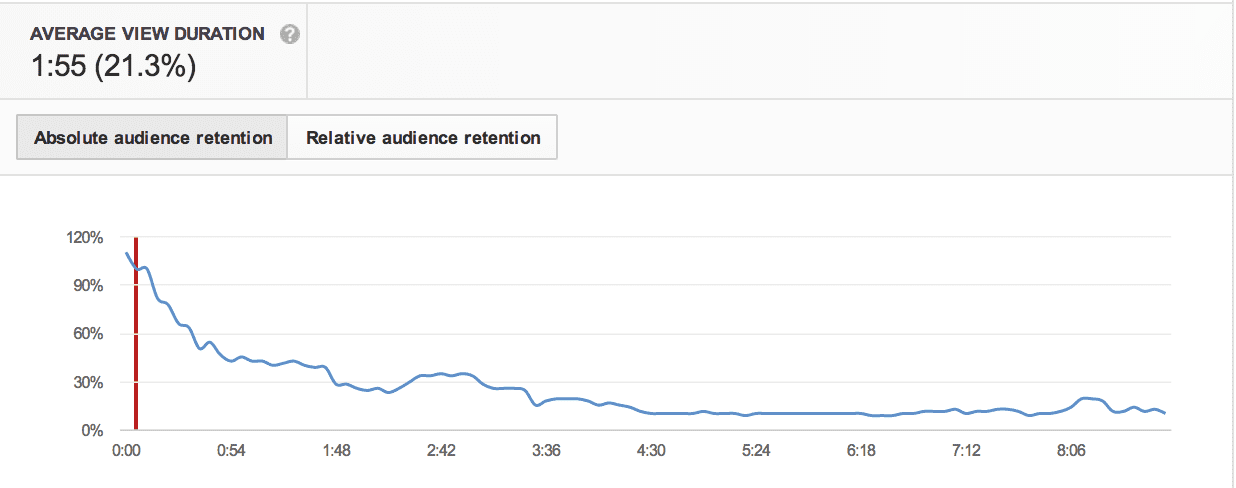
Another very telling aspect of this data is how the audience is responding to the video within the first 10 seconds. If viewers are switching off, you should question your video and whether or not it is meeting viewer expectations. Is your title right for the content? How about your description? Maybe the video itself isn’t doing what you want it to.


YouTube analytics Audience Retention 2


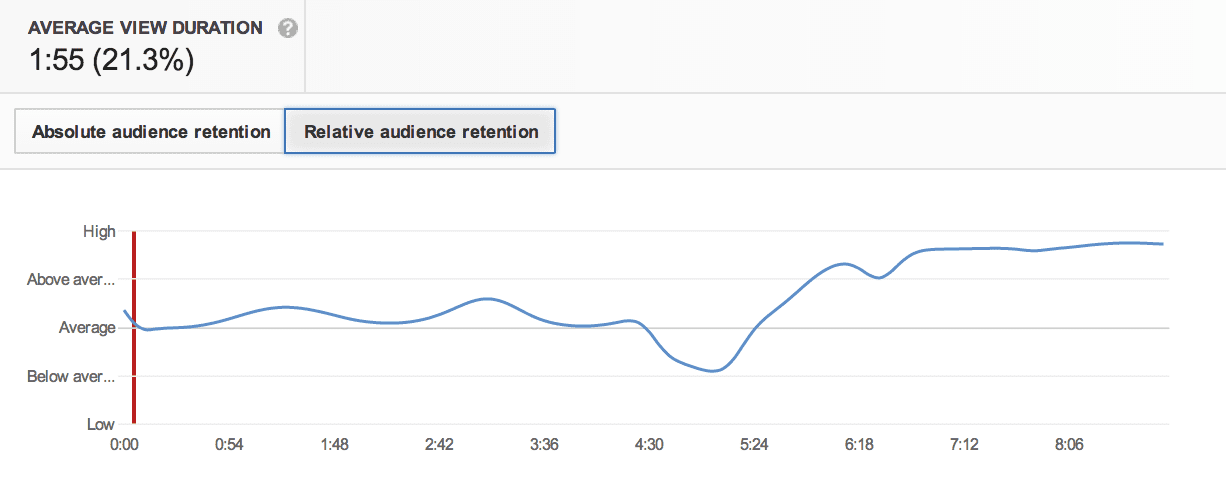
The ‘Relative Retention’ graph tells you how your video is comparing to other videos on YouTube that are of a similar length to yours. This information is useful again in terms of looking at the length and pace of your future projects.


YouTube analytics Audience Retention 3


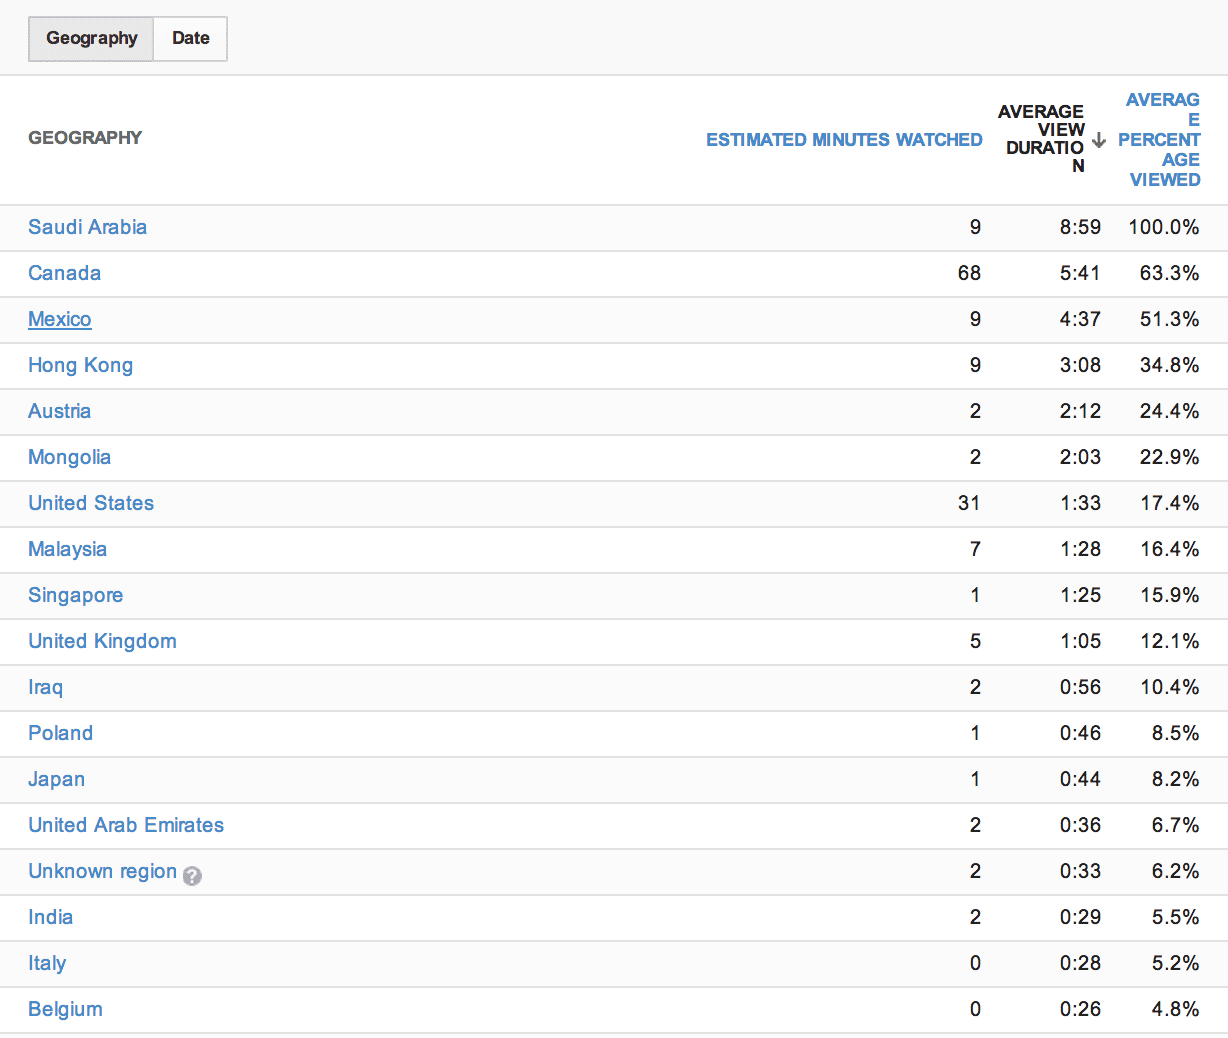
Another useful feature of the Audience Retention aspect of YTA is that the data is broken down by geography and date. In the example of geography, YTA provides information, by country, regarding the average view duration of each of your individual videos.


4 YouTube Annotations data


YouTube introduced annotations as a way for creators to further engage their viewers. Annotations allow the creator to direct the viewer to more of their own videos, or to subscribe to their channel for example. As we are all aware, there are a lot of videos on YouTube. Annotations are therefore an opportunity to hold viewers within the realm of your own videos and encourage a long-term relationship with them through the subscription route.


YouTube analytics Annotations 1


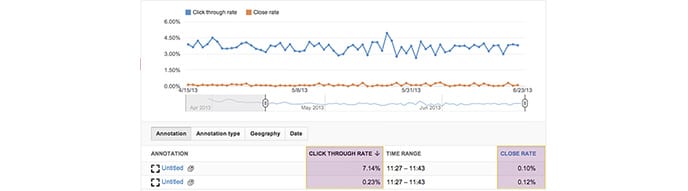
The Annotations report includes Click Through Rates (CTR) – i.e. viewers who interact with your annotation by clicking on them. Close Rates tell you when viewers are failing to click on your annotations. This information is useful for informing you where your annotations are working and where they need improving.


5 YouTube Analytics Interaction


In YTA, interaction is measured by ‘Likes/Dislikes’ and by ‘Comments’ and ‘Sharing’. Content that audiences interact with the most is going to be the content that your audience likes the most and is therefore most successful. This data should inform how you craft future content and the strategies you employ to promote your videos.


YouTube analytics Interaction 1


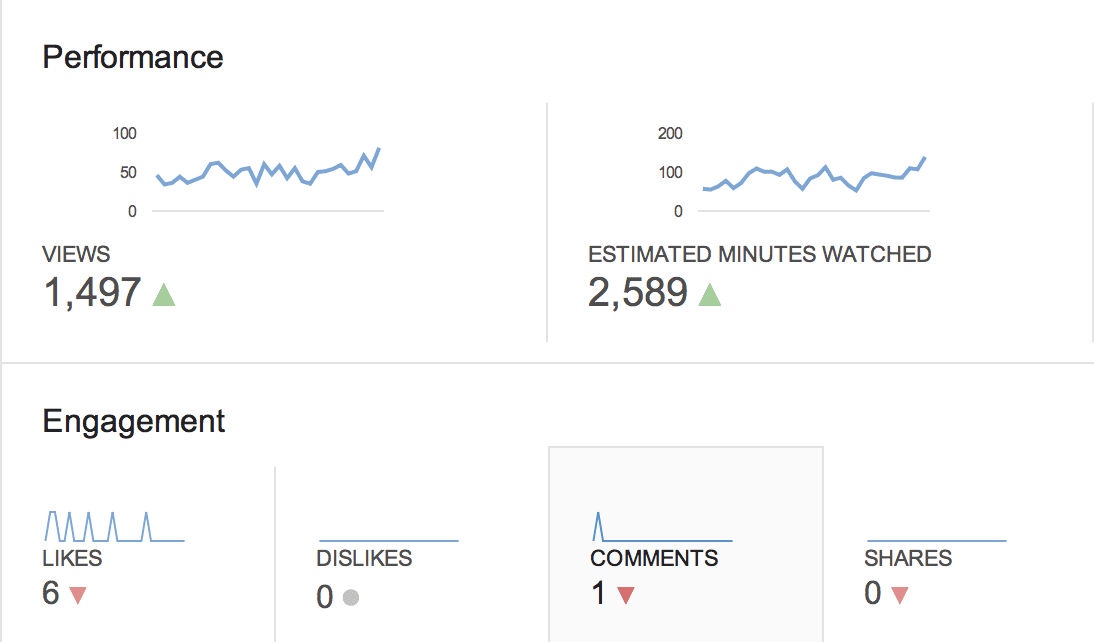
Likes and Dislikes simply inform you which videos your viewers have given the thumbs up or the thumbs down to. The videos that are liked the most are the ones you should be looking to learn from and replicate. If you have had a high rate of dislikes for any particular video, you should spend time considering why and if this means you should avoid similar content in future.


Comments are as much about quality as quantity. Read your viewers comments. They may be indicating to you what they would like to see more/less of, or offering ideas (intentionally or not) for future content. YouTube is notorious for comments that are less than useful. But you might find some diamonds in the rough.


Knowing which videos your audience are more likely to share is useful – if you are keen to achieve more shares, you can incorporate clearer calls to actions in you actual videos, in your annotations and in your video descriptions.


As a tool, YouTube Analytics is useful to revisit regularly to take note of any changes or new trends. You can only improve your channel if you know how it is performing in the first place.


from Smart Insights http://www.smartinsights.com/social-media-marketing/youtube-marketing/guide-youtube-analytics-part-2/

via IFTTT

martedì 26 novembre 2013

Analysing PPC ad performance for low volume ad groups

Practical tips to improve AdWords click volume and quality, particularly relevant for B2B and low volume B2C accounts


PPC traffic, in most accounts, have a very uneven distribution between the ad groups. What I find is that usually there are a few ad groups that get lots of traffic and then lots of long tail ad groups that each get a little bit of traffic.


This makes ad improvement tricky for the majority of ad groups. In order to improve ads we always run 2 or 3 ads in an ad group to see which one performs best over time and then optimise towards the best performer. So unless the ad groups ads have each had a high number of impressions and clicks then we cannot make a decision on which ad is performing best.


Fine for the few high traffic ad groups, but less easy for the majority of the ad groups.


This post shares a few hacks that can be made in order to get to decisions faster and optimise your PPC ads more quickly for better performance.


Traffic Distribution in Adwords Accounts


The chart below uses actual data from a retail client of ours, we just disguised the ad group names to protect their identity:


Adwords traffic distribution by ad group


The data was collected over a month and shows that there were just a few (16) ad groups that received over 100 clicks and then lots (306) that received between 1 and 99 clicks.


Here is the distribution of clicks amongst the top 20 ad groups:


Ad groups traffic for top 20 ad groups


I am not saying that this is the same for all accounts but I do believe that it is pretty typical as most accounts that we have managed map pretty closely.


If you are running 2 ads in an ad group, so effectively an A/B test, you are likely to need more than 1000 impressions before you can determine a winner.


This table, represents the total impressions needed in order to determine a winner of an A/B test to a 95% confidence level. You can run various scenarios in the tool here.


A/B Test significance indicator


From the account we referred to above the average CTR is 4.91% on search ads so the figures get even higher – we need a minimum of 2000 impressions and 100 clicks across the 2 ads approx before we can determine a winner.


Over 1 month there were only 7 ad groups that hit this threshold. So what do we do with all of the long tail ad groups? Just leave them for a year and then have a check?


Aggregating Data


Most PPC accounts have common sense structures based on the company website or on the way people search for the product/service.


This means that you are likely to have ad groups that are very similar to each other – perhaps focusing on the same product or a very similar product.


This means that you can, with relative confidence, aggregate the data across multiple ad groups to identify weaknesses and strengths.


Calls to action


All PPC ads have a call to action and often this may be a common call to action used across multiple ad groups and even multiple campaigns.


e.g.


“Order Today for Free Delivery”


“10% Off When You Order Today”


If you use these calls to action across mutiple ad groups then you can use pivot tables in Excel to analyse them.


This screenshot shows a few ad groups from one campaign that is selling the same type of product:


Ad call to action performance


As you can see the ad groups share common description line 2 (which is often where the call to action is). here we are testing different aspects of the service:


  • Delivery speed

  • Product feature (mattress thickness)

  • Product benefit (comfort)

  • Combinations of the above 3.


The results as you can see are very difficult to call like this, but by simply aggregating it across a whole campaign (takes 1 second in a pivot table) you can see some real performance indicators:


Aggregated ad group performance data


As you can see here it is obvious that the product features are more effective than delivery speed or the fact that delivery is free (at least in the ad).


You can then use this data to make changes en masse to the individual ad groups.


You can also see that although data collected is still small in volume it looks like “UK Hand Made” and also the number of fabric styles available are important to consumers so it may well be worth pushing more traffic to these description line 2′s by using them in more ads.


*A word of warning – you should only use this technique across very similar products/services, never run it across a whole account that has multiple products or services.


Different products and services often have different customers with different priorities so you need to take this into consideration when planning your analysis.


I would love to hear of other techniques that people use to analyse ads effectively and of course if you have any questions then please leave them in the comments below.


from Smart Insights http://www.smartinsights.com/paid-search-marketing-ppc/paid-search-strategy/analysing-ppc-ad-performance-low-volume-ad-groups/

via IFTTT

giovedì 21 novembre 2013

Making the business case for a tag management system

6 reasons you should consider a tag management tool


google-tag-manager With the increasing number and variety of tools now available to the online marketer, it’s possible to learn more than ever before about how visitors to a desktop site, mobile site or app are interacting with the content they find.


There are also an increasing number of tools to target these users through personalisation. However, many of these tools need their own tag adding to the site pages to record and target users. Tag management systems have been developed to make the process of adding and modifying tags easier and less error-prone for site managers.


The release of Google’s Tag Manager has highlighted the value of these tools although this is a free tool while many of the others are paid for.


In the new Smart Insights guide to Tag Management Systems we show the main tag management systems available and explain the issues to consider when managing a project to implement them. We also show how to setup Google Tag Manager since this is now the most popular tool since it is free and makes it easier to add tags for different Google solutions such as Universal Analytics, Doubleclick ad management and AdWords Remarketing.


In this post we explore the main business benefits for implementing tag management systems which can form part of a business case.


1. Page load speed


Page load speed can be an issue in cases where many tags are implemented on a page. As far back as April 2010, Google issued a notice outlining that page load speed would become a signal in its ranking algorithm effectively meaning that a slow loading page could result in a potentially lower ranking in Google’s SERPs.


Individually Javascript tags may only have a minimal impact on page load time but when there are many of them on a single page the cumulative weight may start to make a difference. By using a tag management tool, the presence of a single “container” tag on a page will reduce of the overall file size of the page and so help make it quicker to load.


2. Speed of implementation


An often-cited gripe of adding tags to a page is the length of time it takes to implement, this is frequently due to the availability of developer resource needed to implement the tag, in addition the procedural framework in some organizations may require formal documentation in advance of submitting a request for developer time to implement the tag and that in itself can take up time. For a large, complex site, perhaps targeting multiple countries, implementation of tags can take months.


The manual implementation process in most cases will also involve a staging server and a test version of the site to ensure the update / addition / amend does not have any adverse affects on the site or break the page(s) in any way. Because of this extra time is involved in the testing process, time that can be saved by using a tag management system.


Bear in mind that the time savings afforded by a Tag Management System do not extend to the initial set up. During this stage developer time is needed for the implementation of the ‘container’ tag as well as the data layer if one is used. This process in itself can be quite lengthy so it is well worth giving this careful consideration.


3. Reduce reliance on IT support


The process for any tag implementation usually takes several steps which could include but not be limited to:


1. A need is identified – either involving the addition of a new tracking tool entirely, or to modify the code of an existing tool


2. A change request is put into the development team, this might or might not include a written request via email or a process management application.


3. The code is added or updated on the development test server.


4. The code is set live on the main site.


5. New applications requiring tags are identified and new tags need to be added or existing ones added.


Once a tag management tool is in place, steps 2-5 can be taken care of by the marketer without any need to bother (or be bothered by) the development team.


4. Convenience


Implementing a tag management tool also reduces the reliance on the IT department in the longer term. Reduced reliance on the IT department is mirrored by increased independence for the digital marketing professional. That greater independence means that the digital marketer is master of his / her own time management and so is freely available to add and amend tagging at will.


It also means that at times when the site is in development lock down, for example coming into the Christmas trading period, tagging which often gets relegated in favor of other more pressing tasks, no longer runs the risk of being completely forgotten.


On the basis that speed and efficiency are paramount, the added convenience of being able to add and update tags at will is a help.


Note: There is still a steep learning curve for the digital marketer in learning how to use the interface of a tag management tool. If tagging requirements are likely to be minimal over time then it may not always make sense to implement a tag management tool.


5. Control


Most solutions that require some form of tag management will likely fall within the jurisdiction of the marketing department. By decoupling the tag management process from the IT department greater control is handed to the specifically to the (digital) marketer which is logically where its should be in relation to this process.


Implementation of local privacy compliance


Given the various different online privacy laws in countries around the world, not least in the EU, the challenge of managing cookie deployment in the context of those privacy laws is no small task. Tag management solutions can help with this thanks to geo-based privacy.


6. Applying section or page-specific rules to track marketing outcomes


Most tag management systems use rules which enable marketers to easily track marketing events such as particular page types being loaded, specific audiences taking action or specific sections of a page being clicked on.


from Smart Insights http://www.smartinsights.com/ecommerce/ecommerce-analytics/making-business-case-tag-management-system/

via IFTTT