Slideshare

giovedì 23 aprile 2015

The Paradox of Choice

Choice is a good thing, right?

LChoiceet us take you back to the grand old days of grocery shopping, when butter came weighed out in a scoop, the grocer knew your children’s names and your favourite cut of beef, and a brand was something you applied to a cow’s bum (not too different to shopping in Lidl today, one might imagine).

Limited choice made shopping a simpler experience in those days ('You can have any colour as long as it's black'), but surely the huge array of brands, eroducts and quantities available in today’s supermarkets make shopping a more satisfying experience? After all, what brunette with frizzy hair and split ends could argue against a shampoo product made specifically to meet her needs?

What's the impact of choice on consumer purchasing and ecommerce?

However, as previously demonstrated in our series of articles on digital psychology, the obvious answer isn’t always the right one when it comes to human behaviour. Excessive choice has been shown in numerous studies to result in consumer dissatisfaction, due to our limited capacity for processing information. This leads us to adopt sub-optimal heuristics (rules of thumb) for decision-making, which may ultimately lead to demotivation and lack of action at the point of purchase, a lack of motivation in task completion, reduced task performance, dissatisfaction and post-choice regret.

These negative reactions to a seemingly positive scenario (an abundance of choice) have been termed by renowned American psychologist, Barry Schwartz, as a 'Paradox of choice' (check out his fascinating TED talk here).

In this post, we will investigate how this paradox was first discovered, how it affects ecommerce retailers, and how the paradox’s effects can be mitigated.

When does too much choice occur, and is this ‘too-much-choice’ effect reflected online as well as in offline consumer environments?

If, as Barry Schwartz in his ‘Tyranny of Choice’ paper states, 'As the number of choices we face increase, the psychological benefits we derive start to level off… Some of the negative effects of choice… begin to appear and rather than level off, they accelerate. (Schwartz, 2004)', where is that point?

George Miller's Experiments on information processing

This question was first addressed in 1956 (in an offline context) by the wonderfully verbose George Miller (whose CV reads like an academic prospectus for the world’s greatest research institutions, having taught at Oxford, Harvard, MIT and Princeton).

Miller’s paper entitled 'The magical number seven, plus or minus two: some limits on our capacity for processing information’, discussed findings from a number of experiments on information processing capacity limits in humans across several sensory elements.

His research concludes that the capacity to process ‘bits’ of information in humans was at, or around the 6-7 mark, although there is slight variation dependent upon the context. Miller refers to amounts over this as ‘information overload’.

Herbert Simon's views of 'Maximisers' and 'Satisficers'

Working in parallel to Miller at Carnegie Mellon University, Herbert Simon was developing the concept of ‘satisficers’ and ‘maximisers’ as a means of categorising human’s approach to choice stimulus.

Simon points out that humans are incapable of fully processing overwhelming amounts of information and that some, which he termed satisficers (satisfaction through sacrifice = satisficing), adopt heuristics to deal with this. These satisficers decide upon an acceptable level across attributes, choose the first option passing that acceptance threshold, and stop searching.

Other humans (maximisers), regardless of innate limits, strive to ‘find the best’, seeking to consider all possible options, in an impossible task, before making a choice (maximising).

Borrowing the terms ‘maximisers’ and ‘satisficers’ from Simon, Schwartz later categorized thousands of people as either maximisers or satisficers using a ‘maximisation scale’.

Schwartz claims maximisers are less satisfied and more regretful post-decision and that more choice is worse than fewer for them. ‘Maximisers’ are unable to cope with being unable to evaluate all options and deal with the opportunity costs of ‘loss of alternatives’. Furthermore, the more options there are, the higher the search costs in terms of time (and arguably money (loss of time)).

Applying Psychology to a chocolate test

To demonstrate these principles in action, let’s look to the world of gourmet chocolates, via Iyengar & Lepper’s 2000 study of demotivation through excess choice. In this psychological study (masked as a market research piece to avoid biasing the results), students from Columbia University were presented with a selection of either 6 or 30 luxury chocolates to evaluate.

The students presented with the lower quantity amount consistently rated their chocolates higher, and as an extra twist to the tale, when offered chocolate in lieu of financial remuneration, the students evaluating the limited choice of chocolates were four times more likely to accept the ‘chocolate money’ as payment.

A more contemporary study, conducted by this article’s joint author, Dawn Anderson, of Move It Marketing, surveyed 100 participants, aiming to qualify the ‘magic number’ for customer choice, originally suggested by Miller.

Study's hypothesis

The study hypothesized that respondents would prefer fewer options in a shop or supermarket environment, but would choose more options when in an online environment, due to the advanced range of filters that are available online. The study also explores the effect of single option availability on buyer satisfaction.

Respondents were asked a series of multiple-choice questions, one of which contained images of jam assortments (designed to partially replicate a similar ‘Jam Study’ carried out by Iyengar and Lepper in 2000.), boolean option questions, and one free numerical entry text question.

Results of the study

The study found that overall, participants had no aversion to a single option display and that 6 jams proved the preferred assortment size (see figure 1). As the assortment size increased, a clear pattern emerged, with popularity inversely decreasing. Whilst participants claimed to not find comparing large selections online either more comfortable or easier than offline, further answers to questions did not correspond with this.

Figure 1 – when asked how many options participants would prefer to choose from

Results

If you’d like a full copy of Dawn’s research, please drop her a line. Contact details are available at the end of this post.

These findings suggest that our human brains, both off and online, just haven’t evolved to deal with choice; understandable, when we consider that supermarkets have only been in existence for a few decades, compared to the hundreds of thousands of years of human evolution that relied on the “I’ll take what I can get” method employed by hunter gatherers.

Excess choice ultimately leads to anxiety, and the brain begins to focus not on what it has, but instead on what it doesn’t have. The greater the sacrifice, the more dissatisfaction is felt.

Reviewing how ecommerce companies are handling consumer choice

How does it work with Amazon?

In ecommerce, this dissatisfaction is amplified thanks to the use of endless aisles. In the high street, even the largest of stores display finite stock due to limitations on floor space, but virtual space is infinite, and as such, when a user searches for  'dresses' on Amazon, they are accosted with 853,694 separate options.

Dress search results

So, as responsible digital marketers, how can we alleviate our customer’s anxiety, and increase their product satisfaction by reducing choice?

Product filtering is key

Having looked to Amazon for the problem, let’s take another look for the solution. Through necessity, Amazon have embarked on an increasingly granular approach to product filtering, allowing users to layer filter upon filter to reduce the overwhelming product range that they are initially exposed to.

Amazon also make use of ‘smart’ filters, which are category specific, adapting as user’s search for different products. Let’s take a search for 'child seats’ as an example. Gone are the colour and size filters offered to dress buyers, to be replaced by seat weight restrictions and child seat safety features.

If the ‘too much choice’ phenomenon occurs as a result of complexity rather than mere volume then marketers may need to consider how best to assist the consumer in choosing, via categorisation, product tagging and in-site search.

Etsy's strategy for managing consumer choice

Homemade goods retailer, Etsy combines these three elements to great effect, resulting in a superior user experience that enhances both browsing, buying and post purchase satisfaction.

Etsy filtersEtsy tags

Alas, Etsy fails to capitalise on these really useful filters (we particularly like the free form tags) as there is no way to layer them – meaning that even the most obscure tags (“native American girl” anyone?) still return an unusable number of results, that cannot then be sub-filtered.

House of Fraser's UX

This is where House of Fraser’s UX really shines. Their filters can be layered on top of each other, to quickly and efficiently reduce the number of options presented to the consumer.

House of Fraser filters

House of Fraser’s filters are clearly displayed at the top of the results page, and can be added/removed ad hock.

By quickly reducing the number of options available into bite size chunks, House of Fraser are reducing consumer anxiety, and enhancing the online experience; and all this achieved by a retailer that sells a complex product range, with everything from luxury women’s apparel to food blenders available online.

Now it’s your turn to reduce your website user’s choices online. Less really is more when it comes to your customer’s satisfaction.

This is the third post in our series by Andrew on applying psychology to improve digital experiences and campaigns. See Andrew's first post on digital psychology - using reciprocity to trigger customer loyalty and second post on using confirmation bias to generate increased retention and spend. If you would like to find out more on the subject, feel free to drop Andrew and team a line, or watch their video on digital psychology.


from Smart Insights http://ift.tt/1DSosqF
via IFTTT

3 Marketing Automation Strategies you can implement today

Simple recipes and tips to get you started with your Marketing Automation

Marketing Automation

Are you still sending out blanket e-shot campaigns to large, anonymous lists? If you are, then the 'shot' part might turn out to mean 'shot in the dark.' In an age where PPC and SEO let you reach a target audience actively looking for companies like yours, blunt emails are rapidly becoming a thing of the past, and 2015 is shaping up to be the year of automation.

Most companies already have all the ingredients - an email platform, a CRM full of client data, and an incoming source of leads gives you everything you need. Getting started can seem daunting, but by starting off with a few basic recipes, you can build up a fully-fledged automated strategy in no time.

Recipe 1: Dynamic Content

Most companies have a wealth of information about their B2B clients in their email database or CRM. Dynamic email content is a great way to put this knowledge to good use by delivering differentiated content which reflects the behaviour and history of your customers. It's possible to do this kind of segmentation manually if you don't mind labouring over a hot spreadsheet for a while, but most CRM and email systems can be integrated to do the hard work for you.

Start off with something simple - if promoting a whitepaper, you could vary your call to action depending on whether your contact is a Technical Director or a Finance Director, for example. An email with special offers could use the purchase history in your CRM to promote discounts on similar products - another great way to keep things relevant for your audience.

This kind of segmentation can lead to click rates being 62% higher, and that's just by utilising information in your email database. If your email platform can integrate with a web analytics platform to include recent browsing history on your site, so much the better. It's also easier to report on single dynamic campaigns rather than multiple-campaign segmentation. However you go about it, dynamic content is a great way to deliver content that your audience wants to see.

Recipe 2: Drip Campaigns

 drip campaignA series of timely emails to your audience can be extremely effective, especially for introducing new clients to your business. Some case studies have shown a 98% conversion rate for these type of 'drip' campaigns; targeted communications sent out to your base at regular intervals to educate clients, welcome new customers and warm up new leads.

Drip campaigns can be especially relevant for businesses with long sales lead-times, helping to stay in regular contact with prospective clients while delivering targeted content.

Drip campaigns are easy to set up, but managing them effectively is key. For a start, see if your email platform supports triggered automatic sending - timing and a consistent experience for all your contacts will be key. It's also important to measure engagement with your campaign and to know when a contact is engaged enough to approach directly. If Lead scoring is a feature you can use to measure and automate this is the perfect time to do so. Long campaigns will also benefit from a preference centre - an alternative to a simple unsubscribe, which offers multiple options to keep your audience involved, and allow further segmentation.

Recipe 3: Nurture Campaigns

nurture campaignLead nurture is often visually depicted as a funnel, but it's really more accurate to see it as a watering can - it allows your audience to branch out and choose their own journey through your pre-planned automated campaigns. In the same way dynamic content will change an email based static fields in your database or CSV upload, a nurture campaign will segment your audience based on their interaction with the your communications, automatically sending them in different directions based on their interests.

This level of automation can help to generate more leads at a far lower cost than using non-targeted static campaigns. A large part of this saving can be attributed to the time saved - a well-planned nurture campaign can span weeks or even months, and after setup can simply be left to run.

From a sales point of view, nurturing is a particularly good option for lukewarm leads - contacts who have engaged with your site or campaigns in a passing sense, but aren't quite ready to be approached with a direct proposition.

To make your nurture campaigns successful, make sure your email designs have plenty of calls to action and links - more choice for your audience means better targeting for you. Connecting the dots between web analytics and email can also give you vital insight into user journeys which can be reflected in your campaigns.

Finding the time to save time

Communigator Marketing Automation CookbookIn 2015, prospects are in charge of how you interact with them; social media and search is all about connecting with your audience when they're looking for you, not the other way around. With enough time to spend analysing your web traffic and campaign results and segmenting your audience manually through Excel and CRM reporting, it's possible to keep up with the demand, but with marketing automation on the rise, more and more marketers are looking at an integrated solutions. For those taking their first steps on the automation path, it's like learning to cook; just take it one recipe at a time.

For a handy strategic guide on implementing marketing automation, check out the Marketing Automation Cookbook.


from Smart Insights http://ift.tt/1DDQ1AV
via IFTTT

mercoledì 22 aprile 2015

Hurdle rates in digital marketing – a definition and examples

Why and how to use hurdle rates to set goals for your digital marketing

Although the idea of hurdle rates seems to be quite widely used within finance and investment circles I rarely hear it discussed with digital marketing. Perhaps there's another name for them I'm missing?

This is surprising since they offer an excellent way to set goals and track performance against them when you are looking at your effectiveness in communicating with an audience. You can use them to review email marketing, ECRM, customer engagement with social media or repeat purchases.Here's a brief introduction to hurdle rates and some ideas on where you can apply them.

Hurdle rate definition

The hurdle rate for engagement is simply the percentage of customers who perform an activity, they have jumped over the hurdle target you set.

The proportion of customers that fall within a particular level of activity or engagement with a brand typically within a time period. This is usually expressed as a target percentage and the number who have achieved it.

For example, the percentage of members of an email list that click on the email within a 90 day period, or the number of customers that have made a second purchase.

The value of hurdle rate

Hurdle rates enable you to assess how many of your audience are engaged with your marketing activities so are useful for benchmarking. You can then set targets to use communications to encourage more customers to "jump the hurdle" or engage with you.

Hurdle rate examples

Here are some examples I've used in different areas of digital marketing:

Email marketing - the level of emotionally unsubscribed - the % who never open or never click in a 6 month period - see this analysis.

  • Email marketing - the level of active subscribers - the reverse - the % of visitors that have clicked within a 6 month period.
  • Social media - likewise - the % of active followers - if you have a Facebook page, Facebook will tell you the proportion of monthly active users. Similarly you could calculate average clickthrough rates across a month in Twitter to see how many of your audience responded. I'm not sure of a simple way to do this. Any ideas?
  • Banking - The % of active online account holders - 90 day active is a standard I believe - the % of online customers who log in at least once in that period. You can also set goals for different activities like checking a balance, using online payment services, etc.
  • Intranet or communities - the same principle can be applied to how many log-in to a subscription site and the activities they perform. How many bloggers leave comments for example.
  • Retail - the example below shows how hurdle rates can be used for Recency, Frequency and Monetary value

Recommended link: Hurdle rate definition in retail - Jim Novo's post about hurdle rates from 2000 which introduced me to the concept of hurdle rates.


from Smart Insights http://ift.tt/105bpSN
via IFTTT

13 psychological reasons why we crave Infographics [Infographic]

An infographic about infographics

We know that visual content increases sharing across social media platforms as Gary Lipkowitz explains in his article on 'Why infographics should still be part of your content marketing strategy. But do you know why our brain craves infographics or visuals on a more scientific basis?

The team at NeoMam Studios have designed this infographic about infographics which summarises why they are such an effective communications tool. Did you that...

"70% of our sensory receptors are in our eyes, it only takes one tenth of a second to understand visual content and that we 'recall 80% of what we see AND do'".

35 reasons your brain craves infographicsIf you're looking for more practical guidance on creating effective infographics for marketing see this article by Dan Bosomworth of First 10 on A checklist of 10 best practices for creating infographics for marketing.


from Smart Insights http://ift.tt/1G5TCt1
via IFTTT

Integrating mobile marketing with customer service

Understanding how your mobile strategy can improve your customer service

Martini generationMost of us find it almost impossible to spend time without a smartphone or tablet close at hand. These days, to quote the famous ad for Martino Rosso, we expect to be connected and online  ‘anytime, anyplace, anywhere.’

Indeed the mobile device has become not only a constant companion but also an essential tool. Witness our shopping habits. According to research organisation IMRG, around half of e-commerce sales in the UK are accounted for by mobile devices. Meanwhile, a 2014 survey by Econsultancy found that 13% of us engage in the art of 'showrooming.' Or to put it another way,  we check out goods in store before buying online, using our mobile devices to compare prices and then make the purchase.

And not only do we shop on the move. These days, just about every transaction is mobile-enabled. We contact customer service, move money between bank accounts, check flight details and book restaurant tables. It's a mobile world.

A sea change in e-commerce

But if the mobile revolution is driving a sea change in e-commerce, online marketers are playing catch-up. Few businesses remain unaware of the importance of mobile and many have developed apps or taken steps to ensure their sites are rendered properly across a broad range of devices.

But that's not quite the same as having a comprehensive mobile strategy. In an increasingly competitive online marketplace, simply enabling e-commerce transactions is not enough. If  you're selling to or communicating with customers via mobile, it's vital to remember that this is no longer a secondary adjunct to better established PC/Laptop channel. For many, mobile is the primary route to online services. Mobile users rightly expect a high quality customer experience, just as they would in store or sitting in front of a big screen.

Enhanced mobile customer service

But becoming a mobile-aware business is not just about replicating existing services or converting via the device. It is also about providing enhanced service and assisted sales support that plays to the strength of the medium.

For instance, when an airline sells a ticket online, that's just the beginning of a relationship that continues as the customer prepares to leave home to catch the flight, arrives at the airport, negotiates security and waits for the gate number to show on screen. Throughout that relationship, the smartphone provides an ideal medium to provide additional information. Similarly, a retailer can provide product information as customers walk around a store.

More fundamentally, mobile devices offer consumers a chance to seek information ahead of making a purchase  or access after-sales care regardless of time and where they are.

Getting the message

Text based messaging provides a cost-effective way to deliver additional layers of service.  For example, live chat is already familiar to (and popular with) online customers who use PCs and laptops. The same chat based engagement can be delivered easily via apps and mobile websites.

Using LivePerson's LiveEngage platform, chat sessions can not only be triggered by on screen buttons, allowing customers to talk directly to agents. Alternatively chat can be actioned by the customer scanning an QR or bar code when in store, again providing easy access to an agent.

Fish where the fish are gathered

As any good angler will tell you, the best place to drop a line in the water is the location where the fish are gathered. And by communicating via mobile chat you are effectively going to find your customers on their devices of choice. Equally important you are meeting their expectations.

A cost-effective channel

Those expectations are increasingly high. Customers want to be able to contact organisations at a time of their choosing, and that is a challenge to in terms of the resources available. However, text based messaging is a cost-effective channel as a single agent can handle multiple engagements simultaneously. This is in sharp contrast to the voice channel on which agents are locked into a conversation with just one person for the length of the engagement.

That's an across-the-board benefit regardless of whether the customer is using a handset or laptop  but  mobile chat/messaging offers a specific cost-saving. Our experience at LivePerson suggests that customer issues are resolved much more quickly on the mobile messaging channel than is the case on PCs and laptops.

In other words, companies with a focus on customer service can engage with their consumers much more efficiently in the mobile space.

Mobile devices are with your customer from the moment the alarm rings to the point at which they fall asleep. There's a good case for saying that your company should also be close at hand via messaging options.

Copyright/Image: 123rf.com


from Smart Insights http://ift.tt/1G5zEOR
via IFTTT

martedì 21 aprile 2015

7 steps towards a more structured approach to Content Marketing

Content Marketing is more than just publishing content...

When Doug Kessler (Velocity Partners) published his Slideshare ‘Crap: the single biggest threat to b2b content marketing’ it rightly got a lot of attention (one million views and counting).

I think that the popularity of this Slideshare was not only because of the great title, but because it highlighted the challenge of getting cut-through as more B2B brands are spending more time on content marketing. Now B2B buyers cannot move for the flood of Ebooks, blog posts, and infographics (which are getting longer by the day!). According to the CMI:

 74% of marketers say they are producing more content than they did a year ago, but 70% of content produced gets wasted each day! 

From my experience of working with brands and training marketers on content marketing, there seems to be a common experience with initial adoption of Content Marketing.  You know you need to be doing something, so you start on say, an e-book. Yet without a plan, defined objectives and a little insight to your buyers issues and pain points, success is limited and ROI will be difficult to define (which doesn’t help content marketing get buy in from the C suite). We know from this Smart Insights-HubSpot research that the majority of businesses don't have a content marketing strategy.

Towards a more structured approach to Content and Inbound marketing

To help provide a structure to follow based on my experience in B2B Inbound marketing projects, I've created a new Smart Insights template (available for expert members) that follows the 7 Step process Planning process outlined below, using a pre-built fill-in-the-gaps style document to use immediately.

Here is an outline of the 7 Steps we have defined in the template.

Step 1: Objective and Goals

Before you brainstorm your blog posts and next hero eBook topic, start by identifying the target numbers.  How many leads do you need? What are your business objectives? What are your Key Performance Indicators?

If you are justifying this marketing strategy for your company, you need to show how it fits in with their overall goals and objectives, and that you will be working with KPIs to review and assess performance.

This stage is also important as you need to know what your sales conversion rates are. For example, if content marketing is to generate 20 sales and you convert 10% of all leads, your content marketing actually needs to deliver 200 leads on your website.

Step 2: Buyer Journey and Pain Points

You would have heard people say, write content that identifies with your prospects pain points.  To get to this golden insight you need to have a good understanding of your customer summarised in Buyer Personas.

Consider the following:

  • What does their buyer journey look like?
  • What channels and forms of content do they touch from Awareness, Consideration and Decision?
  • What questions will they ask at each stage?
  • What keeps them up at night?

Focus on umbrella themes for your buyers and drill down into individual issues and problems that your product or service solves.

Step 3: Content Mapping: audit to the sales funnel

Before you jump into creating more content, have a look at what you already have. Do an audit, but map this to the sales funnel. This is going to show you gaps and priorities on what to start creating first, and will identify existing content that could be recycled or repurposed.

The-AIDA-model

You should filter this using your personas and target audience insights to ensure you have content that matches their pain points. Also filter by sectors if that is relevant for your business.

Step 4: Budget

Before you jump into creating and hiring people to make your amazing content, how much budget do you have to play with? How much resource do you have with your team and staff?

Be realistic with what your budget can achieve, focus on creating content that fills your audit gaps, and recycle and repurpose what you can.

Tip: Don’t just allocate budget for the production, you are likely going to need budget to cover distribution of your content.

Step 5 : Ideas for content

With your budget in place and an idea of how much time you and your team can spend creating/managing the content marketing process, you can start to think about what content you are going to be creating.

Staring at a blank piece of paper can be daunting, so start by focusing on the missing items from your audit. Estimate how frequently you can create content from your budget. Plan the formats you will create content for, i.e. video, blog, ebook, and when you will do it, e.g. 1 per quarter, 1 per week.

Once you have this list, focus on the quick wins – what content can you repurpose and reuse? Do you have a number of blogs that could be made into a book? Do you have a PowerPoint from an industry event that could be turned into a blog pots?


RelevanceSuccessful content needs to be relevant and helpful to your buyer, and answer the questions they are asking.
It also needs to hit them along the buyer journey in a “one of a kind way”, i.e. it shouldn’t appear anywhere else on the web, in what Rand Fishkin called Uniquely Valuable.

 To be ‘Uniquely Valuable’ your content needs to be:
  • A massive upgrade in aggregation, accessibility, and design,
  • Information that is not available anywhere else,
  • Presented in a clearly different voice or style

To help come up with your ideas, I use this formula. Source + Theme + Format + Idea = Engaging Content

  • Source = curated, created, co-market, or recycled
  • Theme = your buyers pain points and issues
  • Format= video, checklist, case study, ebook, reports, podcasts
  • Idea= debates, how tos, news article, top 10s , interviews

Step 6: Promotional Plan

As should now be obvious, content marketing needs a lot of time and resources. Aside from the time and effort you need to invest up front, your content will need continued investment once it’s ready. You need to sell it!

Having a good understanding of your marketing performance across your earned, owned and paid media is crucial for this planning phase. Work out how many visits your blog has; what is the average CTR to a landing page? How many people do you have on social, and what is the average traffic to your landing page? If you have gated content, what is the conversion rate for your landing pages?

Tip: Have a detailed promotional plan in place to support your marketing efforts and highlight what you realistically need to do in order to hit your desired outcomes.

Step 7: Implementation

So, you’ve made it to the end of the process and you’ve done all of the following:

  • Set out and validated realistic objectives of how to reach your business goals
  • Understood your audience’s pain points
  • Planned how you will structure your message along the journey
  • Audited your content stock to highlight your gaps and quick wins to focus on
  • Charged up your team with possible ideas
  • Put a budget and promotional plan in place

Now, you have to do it!

This is where your operational and editorial plans are key to identifying who is going to do what, by when, giving time to approve, produce and promote your content.


from Smart Insights http://ift.tt/1K1iYw1
via IFTTT

Display advertising clickthrough rates

US, Europe and Worldwide display ad clickthrough rates statistics summary

I've put this compilation together to help marketers and students studying interactive marketing create direct response conversion models for digital marketing campaigns.

When I originally compiled these stats from different sources, social media ads were only in their infancy, but they are now established as a mainstay of online advertising. In this latest update I have added a comparison of CTRs for Facebook and Twitter at the end of post.

If you're looking to get more from your display advertising we have an Expert members guide to retargeting with display ads

Display Ad CTR benchmarks - April 2015 update

The best source for current benchmarks is Doubleclick (the display advertising arm of Google) who have this regularly updated interactive Display Benchmarking tool as part of Think Insights. You can select by country, sector and ad format to create your own benchmarks. Here's our summary of current global Ad CTRs:

1. Overall Display Ad CTRs

Across all ad formats and placements Ad CTR is 0.06%

So, this is less than 1 click per 1000 impressions.  

2015 Ad Clickthrough rates - global

2. Rich media CTRs

Rich media Ad CTR is 0.27%

Across standard and rich media, this shows an ad clickthrough rate of 0.14% which is more realistic estimate if ads will be placed on the fold. For Smart Insights advertisers we offer an MPU in the right sidebar above-the-fold and this has a typical CTR of 0.15 to 0.22% depending on the creative and content asset on offer.

Comparison of rich media and standard media CTRs


3. Ad CTR trends 

This chart, also from the Doubleclick shows that the 0.1% CTR has been an average for some time.

Ad CTR Trends

For anyone researching trends in display advertising in different countries or sectors you could try the Doubleclick Ad Research page - these reports don't tend to be updated so frequently though.

Facebook ad clickthrough example

These Facebook Ad CTRs for different types of ad formats are taken from a test run by Smart Insights contributor Marie Page. They show that by using targeting in Facebook it's possible to improve on general Internet ad clickthough rates.

Boosted vs Promoted post vs ad results

Variation in online ad clickthrough rates by country

This is historic data for reference - for the latest use the interactive Display benchmarking tool.

Region Overall Click-through Rate Percent (%)
North America
Canada 0.09%
United States 0.10%
EMEA
Austria 0.11%
Belgium 0.13%
Denmark 0.12%
Finland 0.05%
France 0.12%
Germany 0.11%
Greece 0.17%
Ireland 0.10%
Italy 0.10%
Luxembourg 0.09%
Netherlands 0.14%
Norway 0.11%
Spain 0.12%
Sweden 0.08%
Switzerland 0.12%
United Arab Emirates 0.18%
United Kingdom 0.07%
JAPAC
Australia 0.07%
China 0.12%
Hong Kong 0.17%
India 0.18%
Malaysia 0.30%
Singapore

0.19%

Source: DoubleClick for Advertisers, a cross section of regions, January and December 2009, Published July 2010

For latest data see Doubleclick Display Ad Benchmark Statistics.

Variation in online ad Clickthrough Rates by ad format

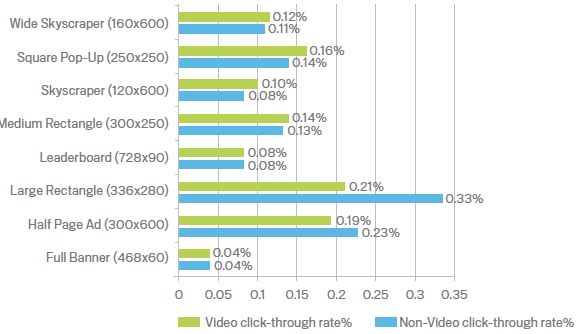
Ad clickthrough rate naturally varies according to placement (position on screen) and ad format (shape and size). The traditional full-banner performs very poorly compared to skyscrapers, the ubiquitous medium rectange and the newer large rectangle format.

Variation in online ad Interaction Rates by ad format

Interaction rats differ for different ad formats in a similar way to ad formats.

Interaction rate definition:

Interactions are defined as the user does one or more of the following:

  • Mouses over the ad for 1 continuous second
  • Clicks an Exit link
  • Makes the ad display in Full Screen mode
  • Expands the ad

Social media ad clickthrough rates - a comparison of Facebook and Twitter CTRs

Wordstream have posted an interesting analysis comparing Facebook and Twitter. It's generally known that Facebook has low CTRs because ad units are not that prominent - it's similar with LinkedIn. Although this is changing as more prominent ad units are created, particularly on mobile.

twitter-vs-facebook-ctr

You can read the full analysis from Larry Kim on Facebook vs Twitter CTRs on Wordstream which includes a wider analysis of the importance of their advertising including mobile.


from Smart Insights http://ift.tt/MWrPUq
via IFTTT